 sMILX
Help
sMILX
Help
Plots
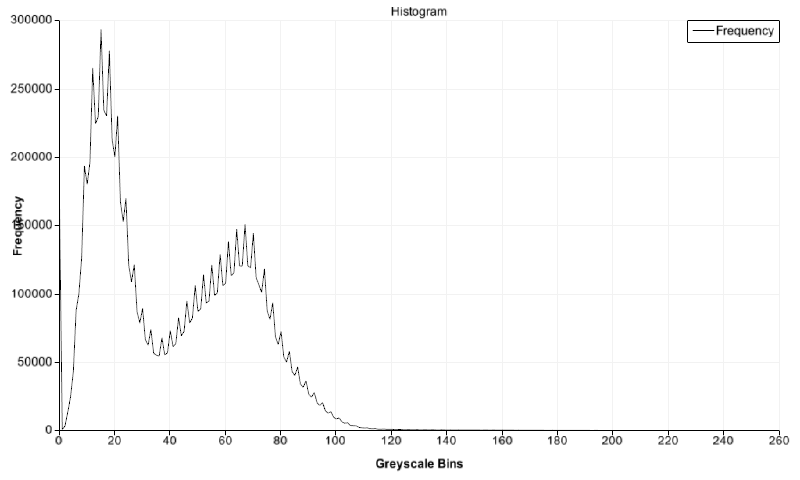
This page describes the plotting
capabilities of sMILX. Scatter plots occur in various operations
for image and models. A classic example is the histogram of an image
and the resulting plot.
Controls:
- Left Mouse Button: Translate the scatter plot in x and y
coordinates.
- Middle Mouse Button: Hold down to draw a rectangle around
the section of the plot to zoom into.
- Mouse Wheel: Zoom in/out of the plot.
- Right Mouse Button: Shows the context menu.
- Save the data for the plot using the save button in the
toolbar or File menu.
The options are mostly available through the right click menu and are
described below:
- Rename Title/Axis: Rename the labels to ones desired.
- Show Points: Whether to show points as well as the line in
scatter plots